
In the following tutorial I will show you how to generate a heat map in python for you geographical data using pandas and folium.
Using the following set of data:
,name,rating,latitude,longitude
0,Paul's Pizza Shop,3.8,30.02096,-95.52322
1,Whole Foods Market,4.5,30.2704305556,-97.75386111110001
2,Polvo's Mexican Restaurant,4.2,30.2452,-97.75751
3,Torchy's Tacos,4.4,30.2937099822,-97.7417280526
4,Fogo de Chão Brazilian Steakhouse,4.3,30.2641638492,-97.7406714816
5,Banger's Sausage House & Beer Garden,4.5,30.259219,-97.7382949
6,La Condesa,4.1,30.2656391,-97.7477811
7,North By Northwest Restaurant & Brewery - Stonelake,4.3,30.39082,-97.73889
8,24 Diner,4.2,30.2720805556,-97.75401388889999
9,Blue Dahlia Bistro,4.4,30.268975,-97.72871388889999
We will generate a beautiful map with this geographical points-based latitude and longitude coordinates.
Firstly, save the data from above to a file named data.csv.
Install the following python libraries: pandas and folium with pip.
pip install pandas foliumImport packages which will be used:
import pandas as pd
from folium import Map
from folium.plugins import HeatMap
Import the csv file into a pandas DataFrame:
df = pd.read_csv('data.csv')We will make a Map object fixed at close coordinates and a zoom of 8:
for_map = Map(location=[30.169621, -96.683617], zoom_start=8, )Define the HeatMap object with its attributes, also using our coordinates for represented point:
hm_wide = HeatMap(
    list(zip(for_map.latitude.values, for_map.longitude.values)),
    min_opacity=0.2,
    radius=17,
    blur=15,
    max_zoom=1,
)
And finally, attach the HeatMap object to our map, this line will also generate the map and plot it:
for_map.add_child(hm_wide)The resulted geographical map
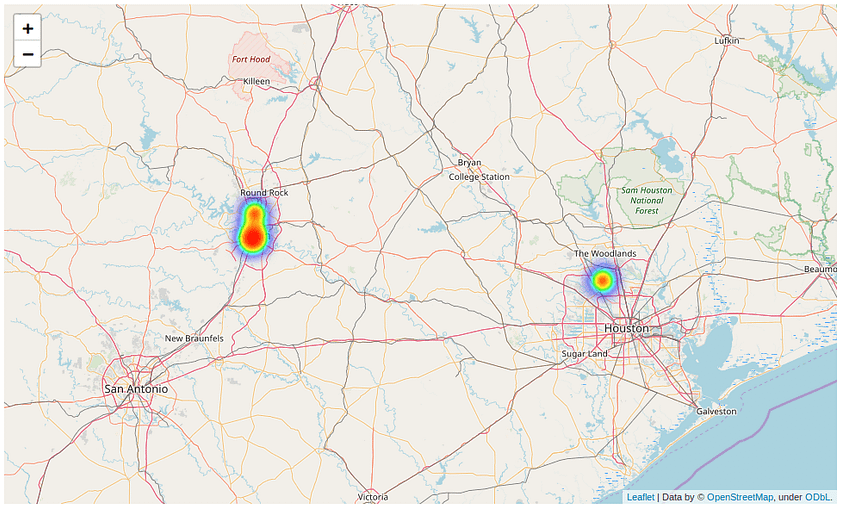
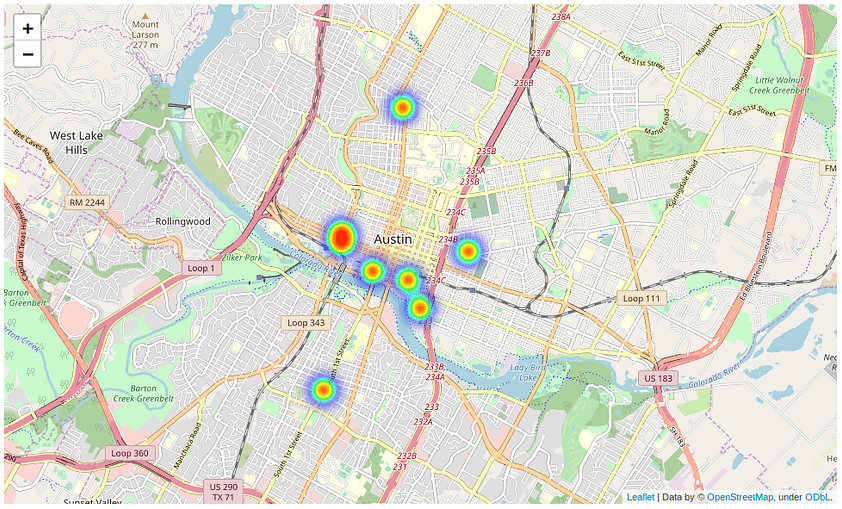
Also, you can zoom in and see the points:

The whole project with its code and data is available on Dropbox.
Alin, thanks for the great tutorial – I think there’s an error in the line df = pd.read_csv(‘data.csv’). you use ‘for_map” which causes a name not defined error when it’s run, but when I downloaded the code from Dropbox, the correct line for_map = pd.read_csv(‘data.csv’) is in the python file. Just thought I’d let you know.
Thank you for your feedback, Dave!